
We had been working with a client, load-testing their system before every release. The system was a standard one, nothing special: AWS LB, Kubernetes, multiple replicas of services. The load test was also more or less standard.
Once, when releasing a code change, we were running our routine load tests and noticed something odd - from the beginning of the load test, load was climbing gradually on all instances, until at one point a single instance skyrocketed in resource saturation (CPU%, MEM%) and the load on all the others dropped. The load graph looked like this:
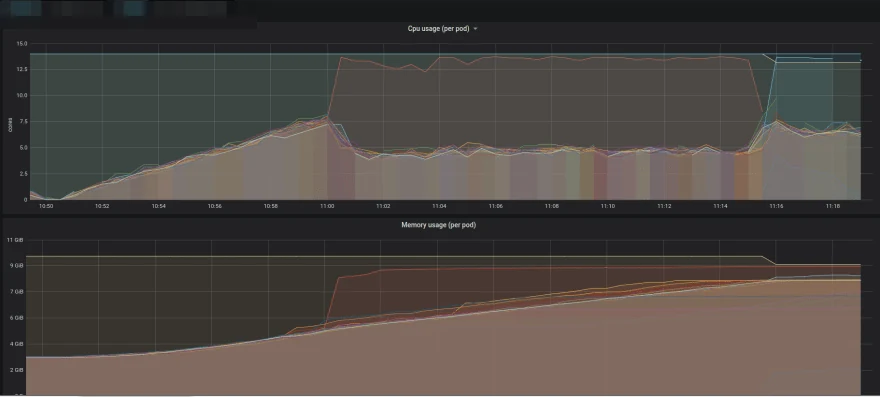
The release itself did not contain anything suspicious, and all the replicas were running the same codebase. Load was balanced using CoreDNS (i.e. round-robin), and there were no stateful or sticky connections. Any of these would have been a perfect explanation for what was happening, but none of them applied to the system we were testing...
Thread dumps did not show anything suspicious: normal webapp traffic being processed on all the instances, with one of them having substantially more active threads, even though the configuration was the same across all the replicas.
Profiling did not reveal anything useful either - same as the thread dumps.
For the sake of completeness, we decided to take a heap dump (Java) during the load test. Our eyebrows were already raised, but capturing the heap dump raised them even higher - as soon as we fired the jmap command, load dropped... on ALL the replicas. Completely. The heap dump itself did not shed any more light on the issue, but the process of capturing it and the effect it caused gave us ideas. And a headache.
jmap does not do much - it just halts almost all the JVM threads, so all request processing is effectively frozen. We tried to mimic this behaviour manually and sent a SIGSTOP to the JVM PID. And indeed, the result was the same.
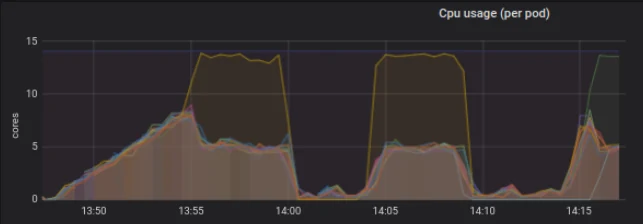
Still, it did not explain the one-off replica...
The next day we tried random things, basically poking the problem with a stick. If that oddball pod was killed, another pod picked up its role right away (see the graph). The weirdest thing was that at any given time there was exactly 1 odd instance: no more, no less. We found another curious behaviour: if we ran a busy-wait (while :; do :; done) on a healthy replica, THAT replica started misbehaving, and the previous oddball instance became a normal one. None of this made much sense at the time - we kept getting more questions and fewer answers...
A couple of days later we started considering giving that release a conditional sign-off at the performance QA gate. Nothing worked, nothing gave us more insight. We stepped back and started writing down the things we knew:
- exactly 1 instance at a time is running at the redline
- it also has the most active threads
- as soon as that instance starts redlining, the other instances are slightly relieved
- a slight performance degradation on a "healthy" replica immediately attracts the "curse"
- SIGSTOPping any instance effectively stops all the instances
- the load is applied repeatedly, running sequential flows
- load is distributed round-robin, without any heuristics, meaning each request lands on the next replica
The SIGSTOP case was probably the key to the "A-HA!" moment. All instances stop because round-robin eventually hits the suspended node and waits for its response before signalling LoadRunner to call the next action. This effectively aligns the load on a single replica. Sure, timeouts and retries happen, hence the smaller peaks and valleys during the STOP in the graph, but most of the traffic is frozen on a single node. The other ones simply don't receive any.
The same mechanism applies under normal traffic. Just as it takes only the tiniest dips in the sand for the wind to build huge dunes, it takes only slightly higher resource saturation on one instance for it to become a bottleneck: more requests take slightly longer there, which starts a vicious cycle. Eventually that single replica's resources are fully saturated, it "draws" (actually more like "holds on to") more requests, reducing the load on the other replicas, and exhibits the behaviour we were seeing in this case.
We explained the bug profile to the dev team and went bug-hunting. The bug was found by one of the developers - it was a slightly more CPU-intensive implementation of a service feature. The release was delayed, the bug was fixed, retested with no performance degradation, and signed off by our (PerfEngg) team. Only a good while later did we find out that there is actually a documented version of this behaviour - it's closest to the Convoy Effect, and related to The Thundering Herd Problem.